Strategy Statistics (Leverage 3 times)
All trades
Long trades
Short trades
Initial capital
100000.00
Ending capital
2366265.28
2076665.68
389599.60
Net Profit
2266265.28
1976665.68
289599.60
Net Profit %
2266.27%
1976.67%
289.60%
Exposure %
40.11%
25.94%
14.17%
Net Risk Adjusted Return %
5650.21%
7620.81%
2043.51%
Annual Return %
37.97%
36.15%
14.84%
Risk Adjusted Return %
94.66%
139.37%
104.70%
Transaction costs
652729.90
360666.32
292063.58
679
377 (55.52 %)
302 (44.48 %)
Avg. Profit/Loss
3337.65
5243.15
958.94
Avg. Profit/Loss %
0.34%
0.57%
0.06%
Avg. Bars Held
1488.95
1730.23
1187.75
Winners
284 (41.83 %)
191 (28.13 %)
93 (13.70 %)
Total Profit
5337627.29
3467373.34
1870253.95
Avg. Profit
18794.46
18153.79
20110.26
Avg. Profit %
1.85%
1.86%
2384.11
2582.03
1977.61
Max. Consecutive
10
11
5
Largest win
177781.49
148094.95
# bars in largest win
3515
2724
Losers
395 (58.17 %)
186 (27.39 %)
209 (30.78 %)
Total Loss
-3071362.01
-1490707.66
-1580654.35
Avg. Loss
-7775.60
-8014.56
-7562.94
Avg. Loss %
-0.74%
-0.76%
-0.73%
845.34
855.52
836.28
9
8
16
Largest loss
-82261.00
-47561.22
# bars in largest loss
461
394
Max. trade drawdown
-259573.53
-96421.06
Max. trade % drawdown
-6.82
-5.69
Max. system drawdown
-520221.35
-195384.27
-594835.60
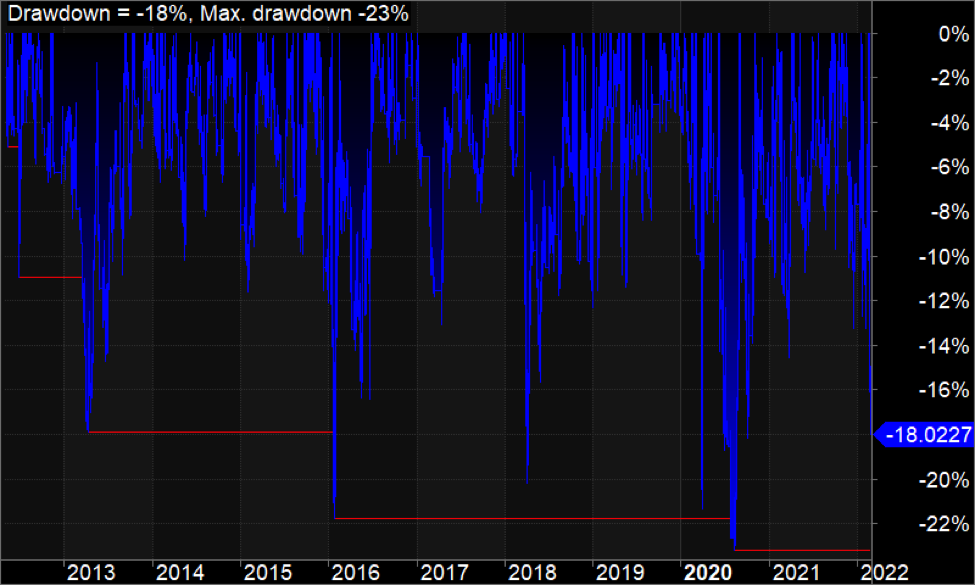
Max. system % drawdown
-23.16%
-20.70%
-99.95%
Recovery Factor
4.36
10.12
0.49
CAR/MaxDD
1.64
1.75
0.15
RAR/MaxDD
4.09
6.73
1.05
Profit Factor
1.74
2.33
1.18
Payoff Ratio
2.42
2.27
2.66
Standard Error
265424.46
245874.65
83922.67
Risk-Reward Ratio
0.65
0.13
Ulcer Index
7.03
4.57
44.33
Ulcer Performance Index
4.63
6.72
0.21
Sharpe Ratio of trades
1.26
1.99
0.02
Year
Jan
Feb
Mar
Apr
May
Jun
Jul
Aug
Sep
Oct
Nov
Dec
Yr%
2012
N/A
3.6%
1.8%
24.4%
-1.6%
3.8%
-1.5%
6.7%
0.8%
41.9%
2013
1.2%
-3.6%
-3.5%
-3.7%
3.4%
-2.2%
-1.3%
8.4%
12.9%
2.7%
1.5%
23.2%
2014
3.1%
12.7%
-3.3%
-0.1%
4.5%
0.7%
-3.0%
4.1%
9.7%
1.1%
1.3%
29.4%
2015
4.6%
-3.8%
11.1%
1.7%
-1.9%
-2.3%
7.1%
-5.0%
16.6%
6.5%
-9.5%
36.7%
2016
-9.8%
16.2%
0.6%
-1.8%
2.6%
8.0%
3.2%
-2.5%
0.5%
-1.0%
28.5%
2017
-0.8%
-0.7%
-5.7%
9.0%
-3.4%
2.5%
18.7%
2018
11.0%
-4.3%
2.0%
-6.3%
5.8%
-0.5%
-2.0%
10.9%
-1.7%
23.7%
2019
2.3%
11.7%
1.0%
6.3%
7.3%
51.6%
2020
13.9%
7.7%
14.8%
16.8%
0.4%
83.0%
2021
-0.4%
3.5%
-10.6%
-2.7%
3.3%
2.1%
13.5%
2.2%
2.8%
0.3%
24.8%
2022
14.4%
5.0%
17.1%
Avg
5.6%
0.2%
5.1%
5.3%