With the Time, everything changes! This is not only true for Humans but for markets also. After all, Markets are driven by Human emotions!
2022 (The year of Collapses): Let us recap what we have witnessed in the year of 2022 till now in terms of Cryptocurrencies. We can say that it was one of the bad year for Cryptos wherein we saw Luna Collapse (one of the Cryptos) then FTX scandal and bankruptcy, Markets were digesting this news however suddenly we saw Signature Bank Collapse which was one of the Capital providing banks for the Crypto industry. And now, Silicon Valley Bank Collapse which was mainstream banks for Technology startups. We have continued to witness contagion effects of the above collapses on other small and medium level banks. In short, we can say that post the 2008 financial crisis, US banks are once again in tremendous pressure!
Bitcoin – Is it Safe Haven?: Amid any kind of uncertainty, usually we have seen that funds goes into US Dollar or Gold due to safe haven bias. However, this time we have one more asset class where money has started to flow in the early part of 2023 which is Bitcoin. From the lows near $15500 level, it has rose by almost 80%. Whether this is short term effect or long term that time will tell us. However, in general we are able to see that people have started taking interest in adopting Digital assets due to recent Banking collapses.
As Bitcoin has showed sharp rally recently, below we are trying to understand what kind of price pattern it has formed in the past! By observing the past behavior, we can arrive at the probability of future trend from hereon!
Chart1:
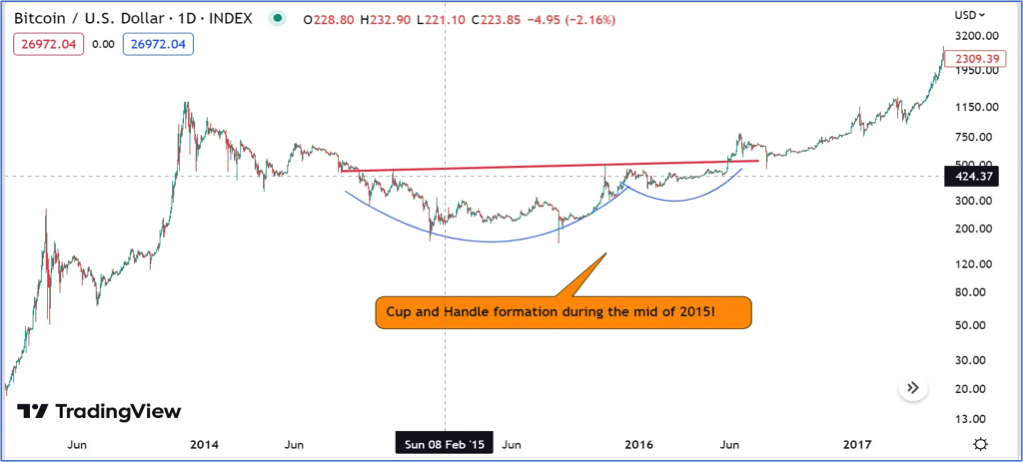
Here in the above chart1, we can see that 2014 was the first year after the long bull run in which Bitcoin started time and price bound correction. Post the corrective phase, prices formed ‘Cup and Handle Pattern’ during the mid of 2015 to the mid of 2016. After that, there was no looking back and prices tested the highs near $20000 level by end of 2017 from the breakout level near $500.
Chart2:
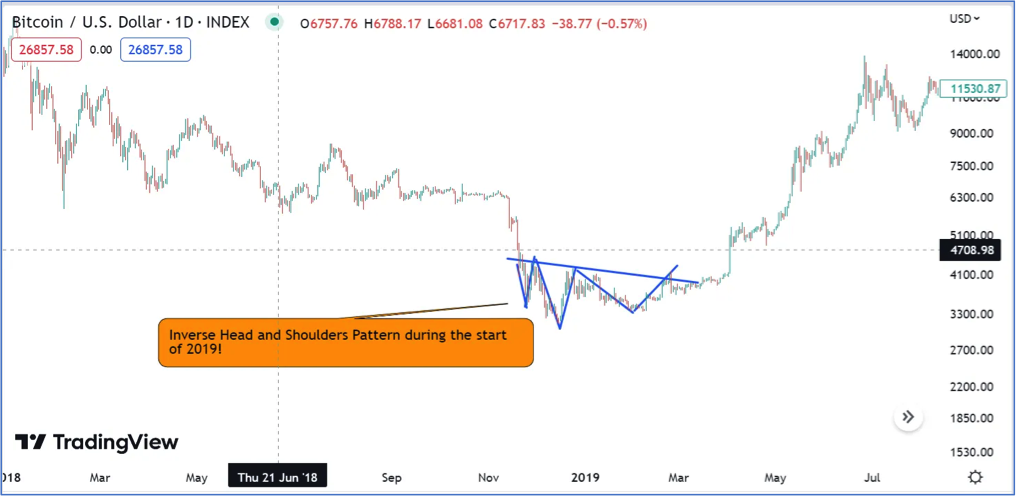
Here in the chart 2, the Bear market which started in in the year of 2018 got completed by the early 2019. During the bottoming phase, it formed more like “Triangle Pattern” and resumed the bull trend. This time prices rallied from the breakout level near $4100 level to the highs of $14000 level by mid of 2019. Post that bull market got interrupted by intermediate correction led by Corona crisis.
Chart3:
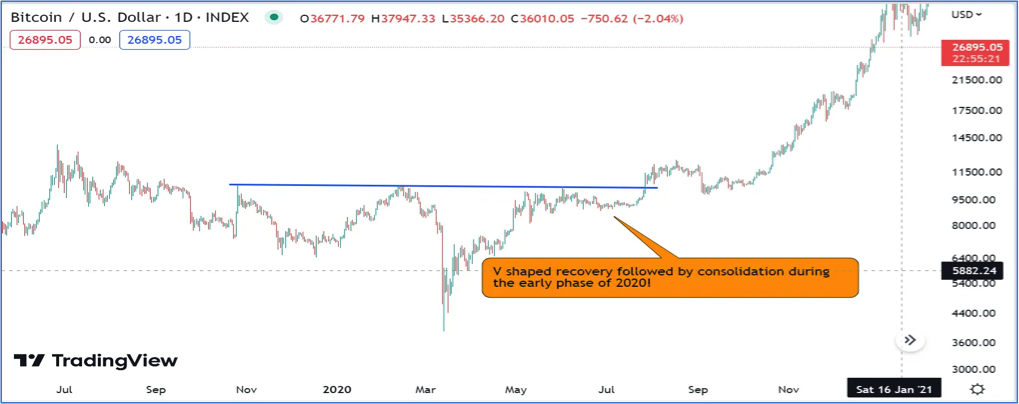
In the early start of 2020, we saw lot of volatility led by Covid-19 crisis as shown in chart 3. We saw major crash from $10000 to $4000 level and then ‘V shaped recovery’ towards $10000 level. Post the recovery, prices managed to digest the gains and resumed the major bull trend in September 2020. The above pattern can also be called as Inverse Head and Shoulders Pattern however due to lack of symmetry between right and left shoulders we would like to call it has normal price pattern where in Bitcoin made higher high higher lows structure. Post this pattern, prices rallied from $10000 level to $65000 level by mid of 2021.
Chart4:
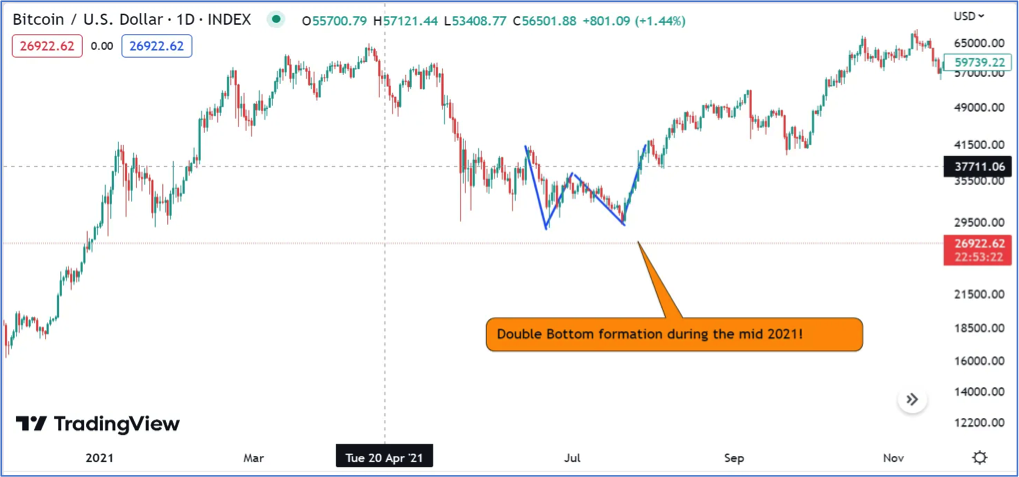
In the month of April 2021, Bull market was interrupted by intermediate correction which completed in the month of August 2021 as shown in chart 4. During the bottoming phase, prices made ‘Double Bottom pattern’ and resumed the bull trend. This is also called as ‘W’ Pattern. Post this pattern, prices rallied from $40000 level to the highs of $69000 level by end of 2021.
Chart5:
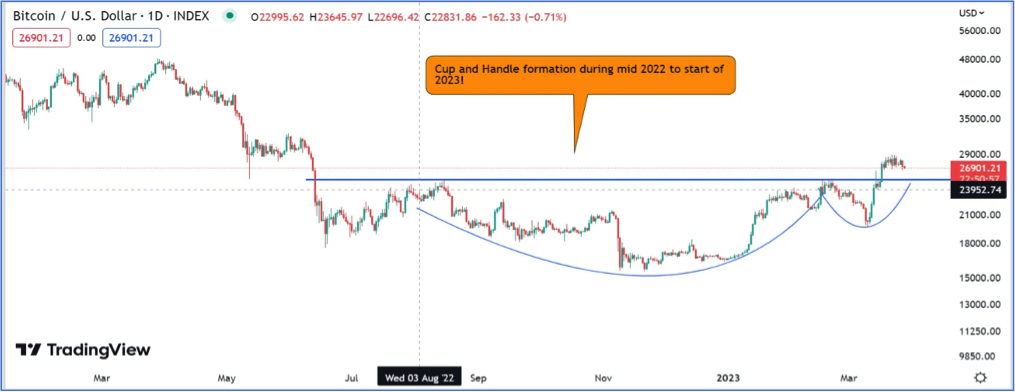
The entire price action since mid of 2022 to the start of 2023 has resulted into text book looking like pattern which is ‘Cup and Handle pattern’ as shown in chart 5. Such pattern often indicates accumulation by smart money and recently we have seen breakout from the pattern. This indicates that bull phase of Bitcoin might have started now.
Time and Price analysis for Bear Markets: Now we will go one step ahead and try to identify whether Bitcoin is following any kind of Cycle or time bound price action in the past observed bear markets. For this, we have considered year of 2014, 2018 and 2021 as a best scenario for analyzing Bear markets as it started when there was bull market Euphoria’s! We are not taking year of 2020 as bear market as it did not start from life time highs i.e it was from the intermediate peak.
Chart6 BTC/USD Logscale monthly chart:
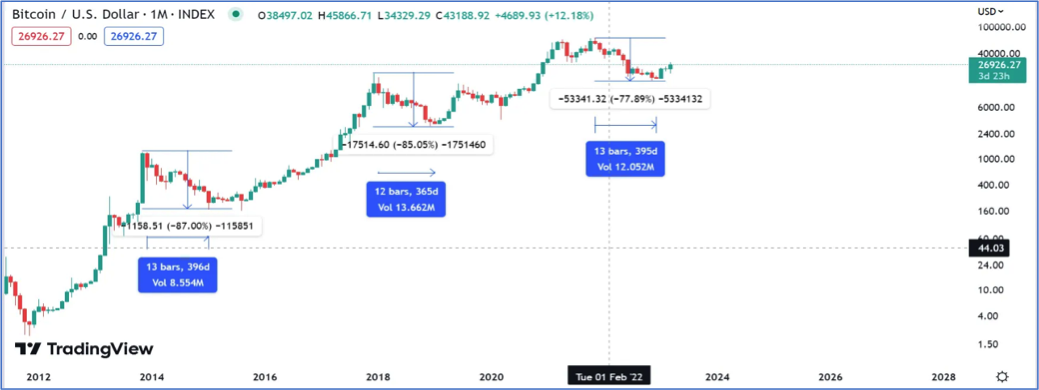
Here we can see that correction of 2014 lasted for 13 months and prices corrected by almost 87% from the life time highs. Correction which started in the year of 2018 lasted for 12 months and correction was seen up to 85% from the life time peak. At the same time, correction of 2021 lasted for 13 months and prices corrected by almost 78% from the bull market peak.
From the above analysis, we are roughly getting the idea that Bear market phase in Bitcoin has lasted for about 12 to 13 months and during the same time it has a tendency to correct by 78% to 88% approximately. This also indicates that post the completion of correction, prices have made important cycle bottom and resumed the bull trend. Hence the recent lows near $15500 might be a crucial cycle lows for Bitcoin which will remain protected in the years ahead. However, as mentioned before, Technical analysis is a study of arriving at a higher probabilities and hence one should place strict risk management to avoid any kind of surprises!
Chart7 BTC/USD Logscale weekly chart:
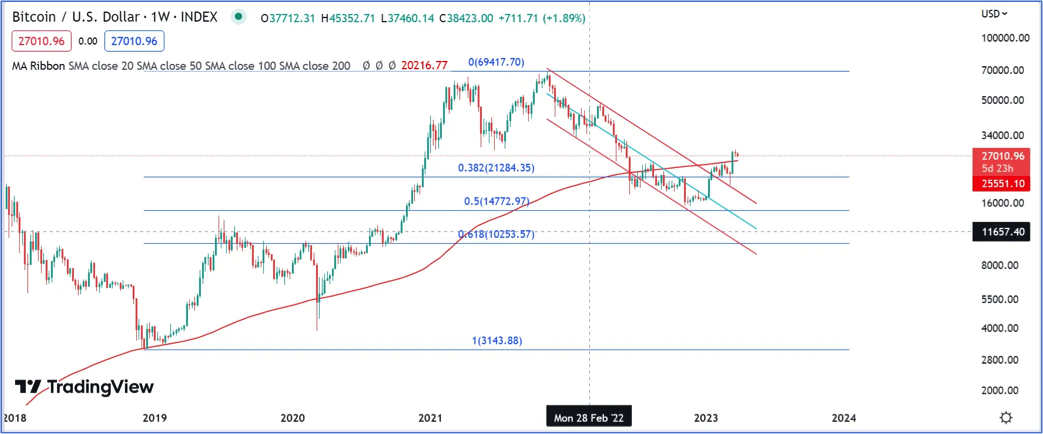
Applying Channels, Fibonacci retracements and Moving averages: Here we are trying to understand the overall trend applying some basic technical tools. The bear market which started in the year of 2021 was channelized in nature. This correction completed near 50% Fibonacci retracement in the end of 2022 of the prior bull trend which started in the year of 2019. Post that prices broke out from the downward moving channel and has made higher high higher lows pattern for the first time since mid of 2021. It is once again back above 200 weeks SMA. Now sustaining above 200 weeks SMA is important to see further strength in the bull trend from hereon.
Nevertheless, above technical tools indicates that Bitcoin might have formed crucial bottom near $15500 level and now it is time to witness bull trend.
Chart8 Logscale BTC/USD Daily chart:
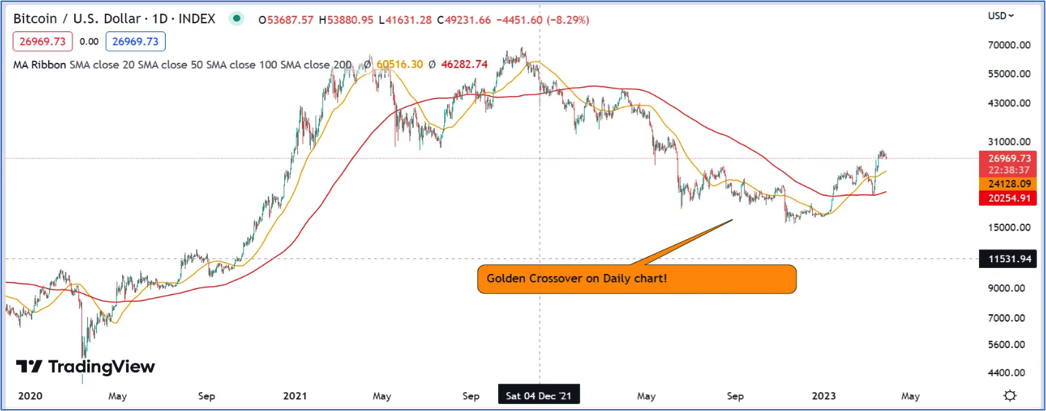
To understand the trend, like many, we are using Golden Crossover in which we use 50 and 200 days SMA. Whenever we see 50 days EMA crossing above 200 days EMA, it is called as a Golden Crossover. Recently we have seen one such signal of Golden Crossover taking place on Bitcoin daily chart in the month of February 2023. This was the first signal since January 2021. Usually post such signal, we can expect market to remain in bullish phase, unless and until it results into failure signal.
Chart9:
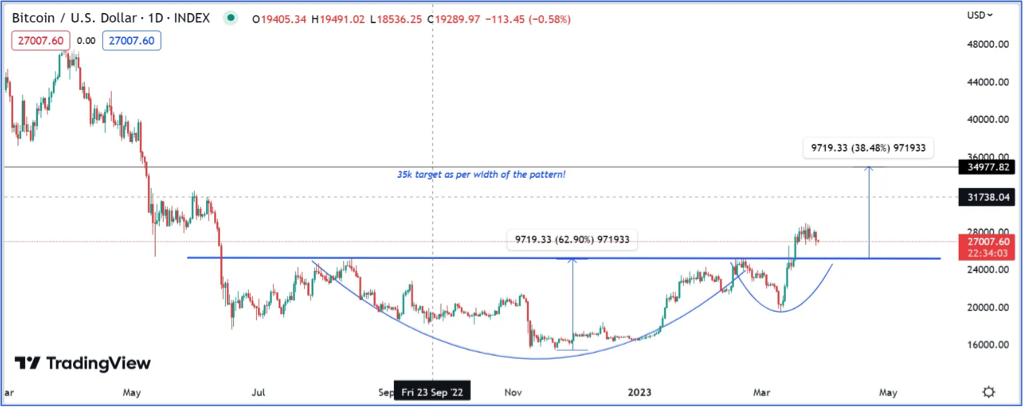
Target of Cup and Handle pattern: We are once again showing recent ‘Cup and Handle pattern’ of which breakout has already taken place in the current month. Prices are sustaining above the threshold line of the pattern which is important for continuation of bull trend. For such patterns, we can expect target to be a width of the overall pattern from the breakout level. Here, the width of pattern is close to $10000 points and hence the target can be close to $35000 level which is $25000+$10000.
From short to medium term perspective, we can expect Bitcoin (BTC/USD) to test approximately $35000 level and post that we need to watch how momentum and price action is developing. If this is indeed start of new bull trend then we are not so far from testing the previous life time highs near $69000 level. Time will tell us!